12 agosto 2013

Os 10 anos mais quentes registrados na Terra aconteceram nos últimos 15 anos, informa o NOAA

2012 State of the Climate: Earth's Surface Temperature

Why it matters

Of all the planets in our neighborhood, Earth has a surface temperature that is uniquely friendly to life. That friendliness is the result of a balancing act between incoming sunlight and outgoing thermal energy—the heat radiated back to space by everything in the Earth system, from land to oceans to clouds and, especially, by the gases in the atmosphere. Everything from sea ice concentrations, to plant productivity on land and in the oceans, to the strength of tropical cyclones is influenced by Earth’s surface temperature.

Conditions in 2012

The global surface temperature ranked among the top 10 warmest years on record. Over land and ocean combined, 2012 was between 0.14° and 0.17° Celsius  (0.25°and 0.31° Fahrenheit) above the 1981–2010 average, depending on the analysis. The globally averaged annual temperature over land was 0.24°–0.29°C (0.43°-0.52°F) above average. And averaged globally, the 2012 ocean temperature was 0.10°–0.14°C (0.18°-0.25°F) above average.
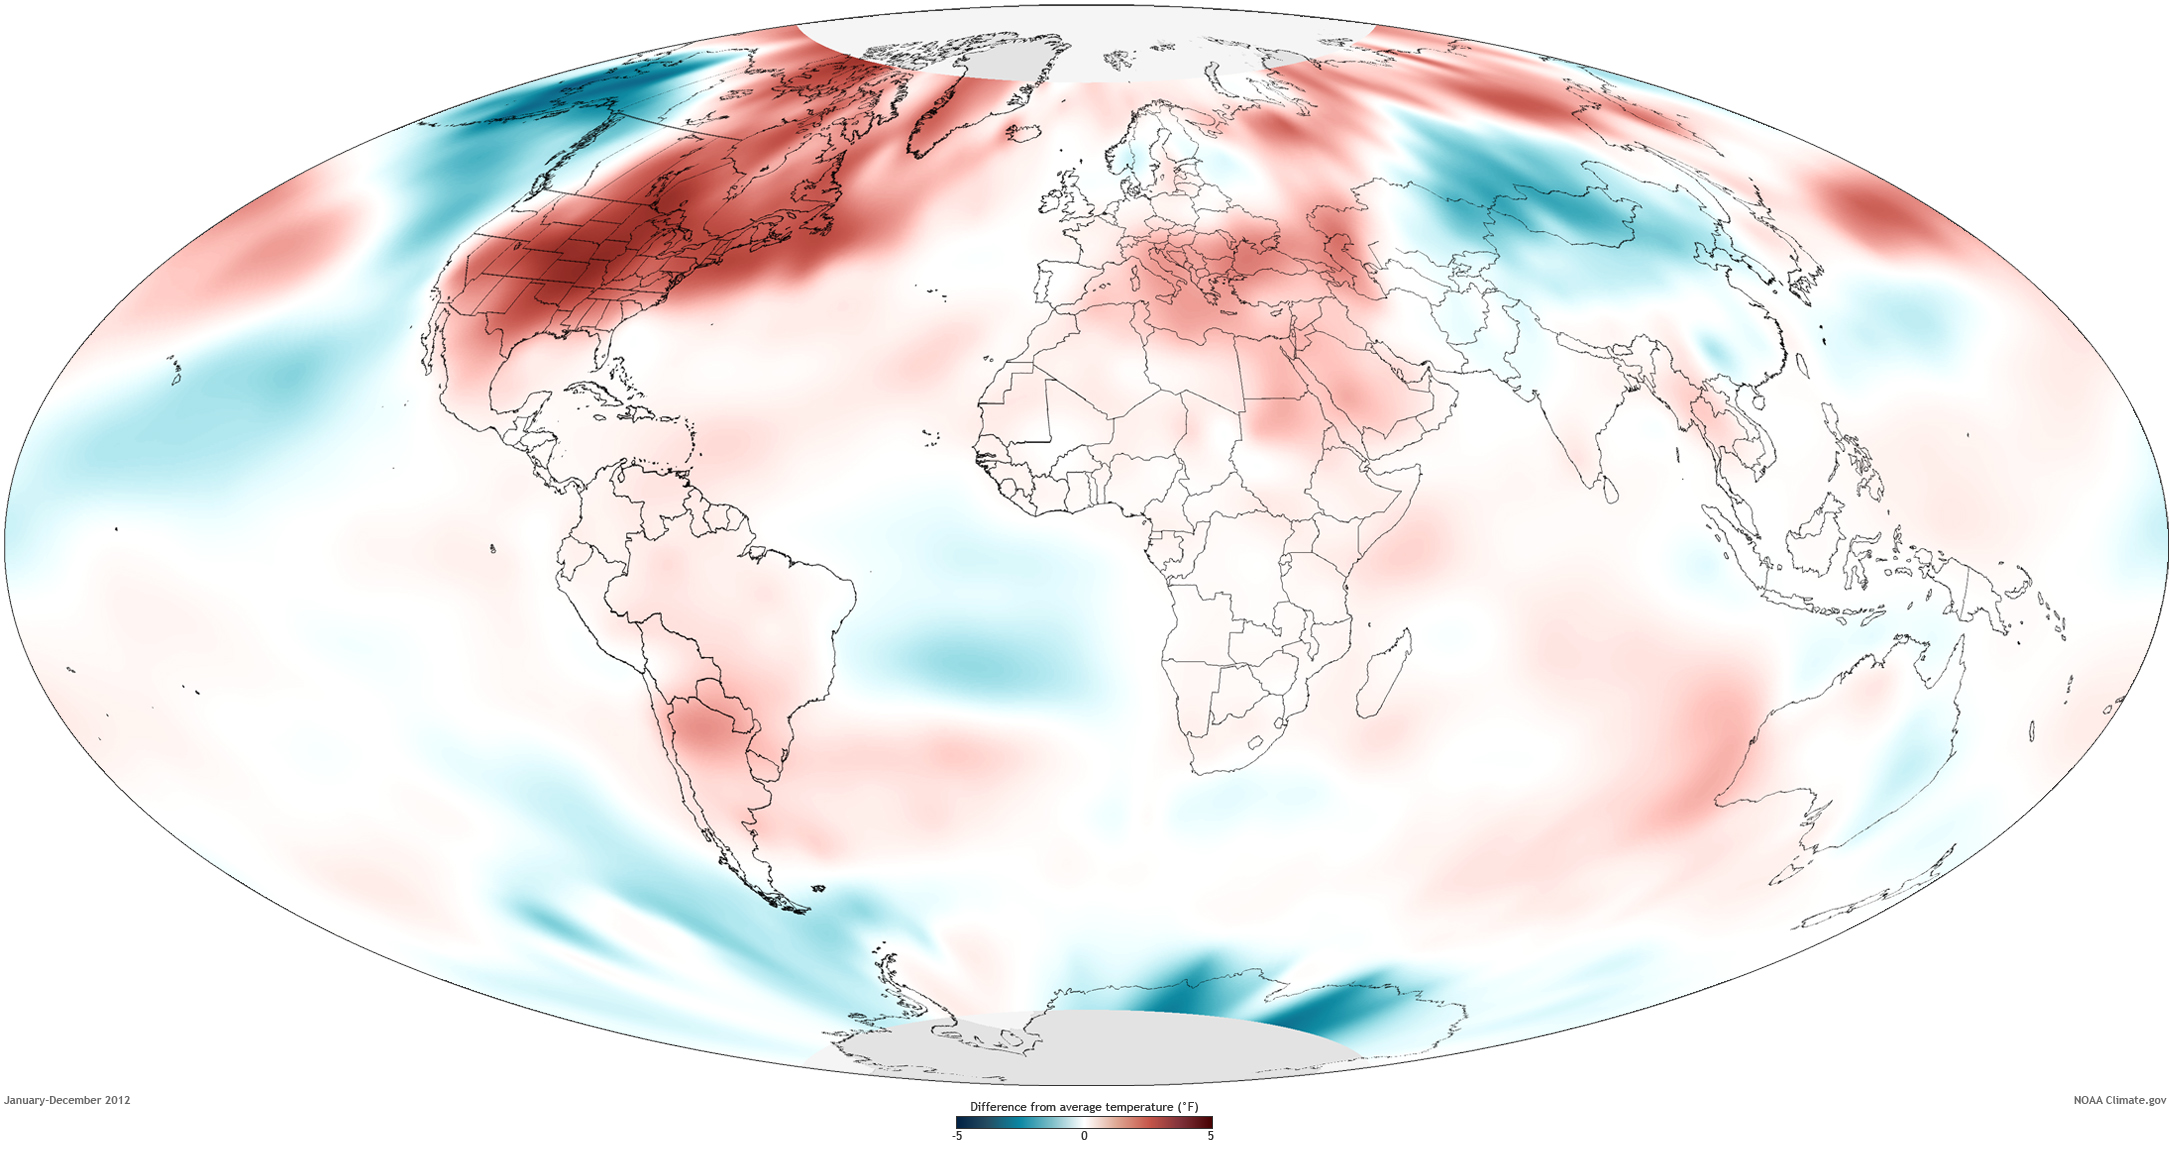
Surface temperatures in 2012 compared to the 1981-2010 average. NOAA map by Dan Pisut, NOAA Environmental Visualization Lab, based on based on Merged Land and Ocean Surface Temperature data from the National Climatic Data Center.
The most prominent warmth during the year was seen across the Northern Hemisphere higher latitudes, specifically the contiguous United States, the eastern half of Canada, southern Europe, western Russia, and the Russian Far East. However, Alaska, the western parts of Canada, eastern Australia, and parts of central Asia all saw cooler than average temperatures during the year.
Nearly all of the ocean surface was warmer than average with the exception of parts of the northeastern and central equatorial Pacific Ocean, parts of the southern Atlantic Ocean, and some regions of the southern oceans. The beginning of 2012 did see some of the lingering cooling effects of La Niña, but they dissipated quickly. Temperatures in 2012 were slightly higher than those of 2011.

Change over time

Earth’s average annual surface temperature is higher today than it was when record keeping began in the mid- to late 1800s, an indicator of long-term, global-scale climate warming. All of the top ten warmest years in the record have occurred since the last major El Niño event, in 1998.
Earth’s average annual surface temperature is higher today than it was when record keeping began more than a century ago. The red line shows how far above or below the 1981–2010 average (dashed line at zero) the combined land and ocean temperature has been each year since 1880. The data shown are from NOAA’s National Climatic Data Center, one of several temperature analyses included in the State of the Climate in 2012, all of which show a similar warming trend. Graph adapted from Figure 2.1, in BAMS State of the Climate in 2012.
Since 1976, every year including 2012 has had an annual temperature above the long-term average. Including the 2012 temperature, the rate of warming is 0.06°C (0.11°F) per decade since 1880 and a more rapid 0.16°C (0.28°F) per decade since 1970, according to the 2012 annual report from NOAA's National Climatic Data Center.

References

Sánchez-lugo, A., J. J. Kennedy, and P. Berrisford: 2013: [Temperature] Surface temperature [in “State of the Climate in 2012”]. Bull. Amer. Meteor. Soc., 94 (8), S11–S12.
Global Climate Change Impacts in the United States, Thomas R. Karl, Jerry M. Melillo, and Thomas C. Peterson, (eds.). Cambridge University Press, 2009.
NOAA National Climatic Data Center, State of the Climate: Global Analysis for Annual 2012, published online December 2012, retrieved on July 23, 2013 fromhttp://www.ncdc.noaa.gov/sotc/global/2012/13.

Mantém-se a tendência de elevação do nível dos oceanos


2012 State of the Climate: Global Sea Level
Author: 

Why it’s important

In the United States alone, just under 40 percent of the population lives in coastal areas, where sea level plays a role in flooding and storm hazards, shoreline erosion, and even city water supplies (where seawater seeps into aquifers). Globally, 44 percent of the people on Earth live within 150 kilometers of the shore, and 8 of the 10 largest cities in the world are near the coast, according to the U.N. Atlas of the Oceans. On shorter timescales—seasons to decades—the rise and fall in global sea level reveal the coming and going of natural climate cycles. Over the span of a century or more, changes in sea level are a sign of a warming or cooling climate.

Conditions in 2012

Global average sea level in 2012 was 1.4 inches above the 1993-2010 average, which was the highest yearly average in the satellite record (1993-present). On a yearly basis, differences in sea level from place to place are largely due to shifts in the position or strength of major currents or else due to natural climate patterns that cause regional cooling or warming. (In general, warm waters have a greater volume, and thus higher sea level, than cool waters.)
Sea level in 2012 compared to the 1993-2012 average based on AVISO satellite data. Map adapted from Figure 3.27a in the 2012 BAMS State of the Climate Report.
In 2012, lower-than average sea levels around the around the west coast of North America were linked to the cool temperatures associated with the negative phase of the Pacific Decadal Oscillation. The sharp divide in the North Atlantic between areas of above-average and below-average sea level are evidence that the warm waters of the Gulf Stream Current reached farther north than usual.
The higher-than-normal sea levels in the western tropical Pacific and Indian Oceans are an imprint left by the La Nina event that continued from 2011 into the first part of 2012. During La Nina, the trade winds along the equator blow more strongly than normal, pushing warm tropical waters westward across the Pacific. The warm waters “pile up” in the western part of the tropical Pacific, spilling over into the Indian Ocean, making sea levels there higher than average.

Change over time

Sea level has been rising over the past century, and the pace has increased in recent decades. Part of the increase is due to more water being added--meltwater from glaciers and ice sheets--and part of the increase is due to rising water temperatures: water expands in volume when it gets warmer.
Graph of monthly global sea level from 1993 through early 2013
Monthly global sea level from 1993 through early 2013 compared to 1993-2012 average, based on AVISO data. Graph adapted from Figure 2.1(x) in BAMS State of the Climate in 2012. 
Since satellite-based global measurements began in 1993, global mean sea level has risen between 2.8 and 3.6 millimeters per year (0.11-0.14 inches/year). In the most recent period (2005–12), meltwater entering the ocean has dominated sea level rise, accounting for more than twice the contribution from warming-caused expansion.
References:
M. A. Merrifield, P. Thompson, R. S. Nerem, D. P. Chambers, G. T. Mitchum, M. Menéndez, E.Leuliette, J. J. Marra, W. Sweet, and S. Holgate. [Global Oceans] Sea level variability and change [in “State of the Climate in 2012”]. Bull. Amer. Meteor. Soc., 94 (8),S68-S72.

03 agosto 2013

Como funciona a maior rede de estações meteorológicas particulares do mundo

Um breve vídeo (1:30 min) sobre como funciona a maior rede de estações meteorológicas particulares do mundo, a Weather Underground. Uma das cerca de 25.000 estações conectadas fica no pátio de minha casa, no bairro Cristo Rei, em São Leopoldo.